Ecology

Goal: To protect and enhance the terrestrial and aquatic health of the natural heritage system.
EMP Ecology Header

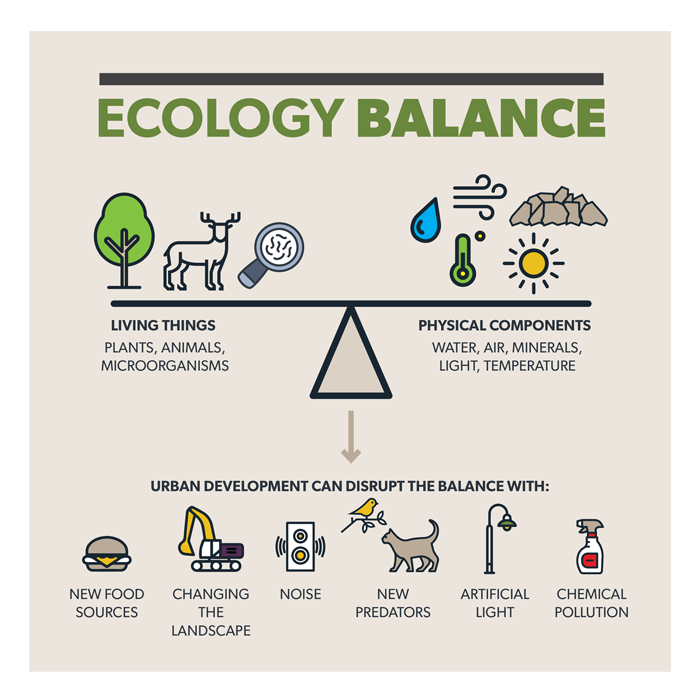
Ecology is the distribution and abundance of organisms, interaction between individual organisms and between organisms and their environment, and the structure and function of ecosystems. Ecosystems have integrity when their native components are intact, including: physical elements, such as water and rocks; the make-up and number of species and communities; and the engines that makes ecosystem work such as fire, flooding and predation. Urban development impacts how these natural systems function.

What can you do?

Check out our progress towards achieving our ecology goals below.

Protected areas

Protected Areas EMP Chart

Monitoring the share of protected areas within Red Deer as a percent of the overall urban area, including natural areas and constructed natural areas.

2023 Results
  Baseline (2018) 2023 Result Target (2035)
Protected areas 8.59% 9.25% 14%
Historical Results
  Protected areas
2023 9.25%
2022 9.25%
2021 9.25%
2020 9.25%
2019 8.75%
2018 8.59%
Pesticide used on public lands

Intensity of Synthetic herbicide use on publicly accessible lands

Monitoring the intensity of synthetic herbicide use on publicly accessible lands (primarily parks, roadways, and public utility lots) owned and maintained by The City.

2023 Results
  Baseline (2018) 2023 Result Target (2035)
Herbicide use (kilograms per hectare) 0.1417 kg/ha  0.0658 kg/ha   0.11336 kg/ha 
Historical Results
  Herbicide use (kilograms per hectare)
2023 0.0658
2022 0.0483
2021 0.0868
2020 0.0649 
2019 0.1162 
2018 0.1417 
Tree species suitability

Tree Species Suitability

Monitoring the percent of the tree population on City owned and managed land that is suitable for Red Deer’s urban environment and adapted to regional conditions. ‘Suitable’ is defined as being a non-invasive, native or nursery cultivated species, which are resilient to local pests and diseases and successfully adapted to the soil and local climate conditions.

2023 Results
  Baseline (2017) 2023 Result Target (2035)
Suitable trees 83% 92% 95%
Historical results
  Suitable trees
2023 92%
2022 91%
2021 88%
2020 88%
2019 83%
2018 no report
2017 83%
Tree species diversity

Tree Species Diversity

Monitoring the percent of genetically diverse tree population on City owned and managed property. A genetically diverse urban forest is more resilient to challenges such as pests and disease.

2023 Results
  Baseline (2017) 2023 Result Target (2035): not greater than
Species White spruce 16%
Colorado spruce 11%
White spruce 16%
Colorado spruce 13%
10%
Genus Picea 27% Picea 29% 20%
Family Pinaceae 35% Pinaceae 39% 30%
Historical results
  Species Genus Family
2023

White spruce 16%
Colorado spruce 13%

Picea 29% Pinaceae 39%
2022

White spruce 15%
Colorado spruce 12%

Picea 28% Pinaceae 39%
2021 White spruce 15%
Colorado spruce 12%
Picea 27% Pinaceae 37%
2020 White spruce 15%
Colorado spruce 13%
Picea 28% Pinaceae 37%
2019 White spruce 16%
Colorado spruce 11%
Picea 27% Pinaceae 35%
2018 no report no report no report
2017 White spruce 16%
Colorado spruce 11%
Picea 27% Pinaceae 35%

* The data presented is currently undergoing a verification process. This means the current numbers that are presented could potentially change once verification is complete.