Energy
Goal: To reduce energy use and move towards using renewable energy sources.
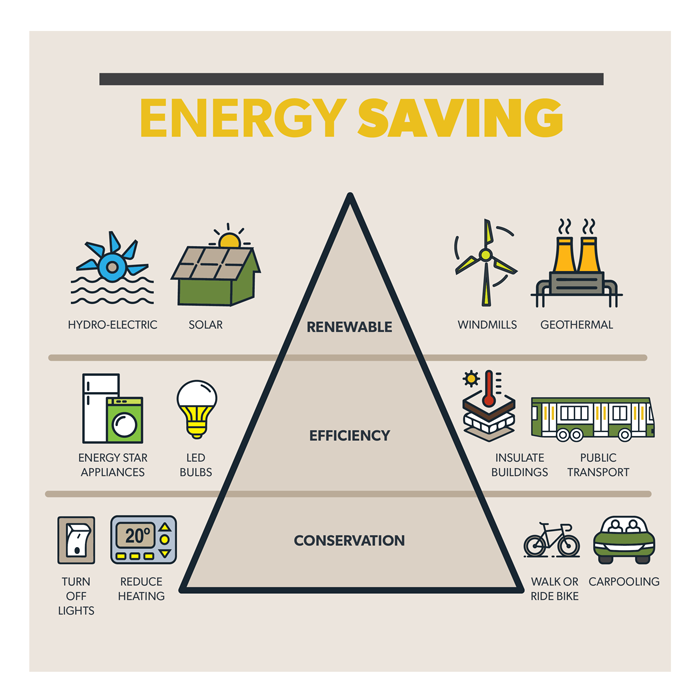
Production of energy can have significant environmental impacts, including increased air pollution and production of greenhouse gas emissions. Reducing the environmental impact of energy use can be achieved through energy efficiency efforts, which can occur from the individual and household level to the city-wide scale. Energy sources such as solar, wind, geothermal and other renewable sources are options to reduce the environmental impact of energy use.
What can you do?
- Improve energy efficiency in your house, business or apartment
- Audit your energy use with the Energy & Water Conservation Toolkit available free at Red Deer Public Library
Check out our progress towards achieving our energy conservation goals below.