Water

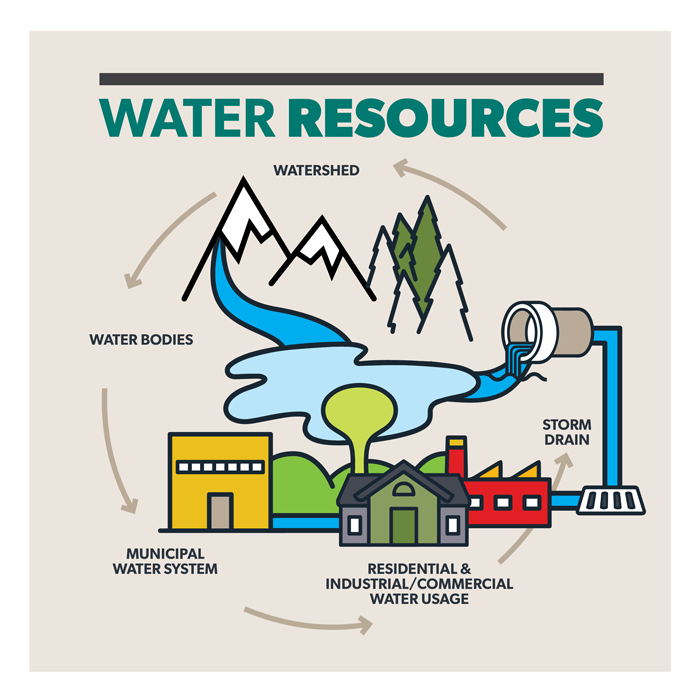
Sustaining our water resources includes understanding and effectively managing issues such as water conservation, water quality protection, watershed well-being, and storm and surface water management. When managed sustainably our watershed, river and municipal water system will support the health of citizens, maintain aquatic and terrestrial environments, enable a variety of beneficial ecological services, provide community recreation options and support a robust local economy.
What can you do?
- Replace any toilets on your property that use more than 6 litres per flush with a low flow toilet (and get a rebate!)
- Audit your water consumption using the Energy & Water Conservation Toolkit available free at Red Deer Public Library
- Capture rain water to use in your yard (and get a rebate!)
- Naturescape your yard using low-water plants and mulch (and get rebates!)
- Make sure only rain goes in the storm drain by Adopting a Storm Drain to protect our river and creeks
- Return unused medications to the pharmacy and properly drain your swimming pool and hot tub
Check out our progress towards achieving our water quality and conservation goals below.
Monitoring surface water* quality in Red Deer.
| 2023 Results - Partly Achieving | |||
|---|---|---|---|
| Baseline (2016) | 2023 Results | Target | |
| Total Phosphorus | 0.0135 mg/L | 0.006 mg/L | Maximum 0.017 mg/L |
| Total Nitrogen | 0.410 mg/L | 0.35 mg/L | Maximum 0.381 mg/L |
| Total Suspended Solids | 3.4 mg/L | 3.2 mg/L | Maximum 4 mg/L |
| Dissolved Oxygen | 11.2 mg/L | 11.06 mg/L | Minimum** 10.4 mg/L |
| E. coli | 11 counts/100 mL | 18 counts/100 mL | Maximum 9 counts/100 mL |
| Historical Results | |||||
|---|---|---|---|---|---|
| Total Phosphorus (mg/L) | Total Nitrogen (mg/L) | Total Suspended Solids (mg/L) | Dissolved Oxygen (mg/L) | E. coli (count/100 mL) | |
| 2023 | 0.006 | 0.35 | 3.2 | 11.06 | 18 |
| 2022 | 0.012 | 0.440 | 3.05 | 10.88 | 15 |
| 2021 | 0.012 | 0.430 | 3.20 | 10.97 | 13 |
| 2020 | 0.0120 | 0.410 | 3.25 | 10.9 | 13 |
| 2019 | 0.0110 | 0.390 | 2.90 | 11.0 | 11 |
| 2018 | 0.0120 | 0.400 | 3.10 | 11.0 | 11 |
| 2017 | 0.0125 | 0.410 | 2.90 | 11.2 | 11 |
| 2016 | 0.0135 | 0.410 | 3.40 | 11.2 | 11 |
* surface water is any body of water found above ground, e.g. rivers and creeks
** Adequate dissolved oxygen is necessary for good water quality. For example, when dissolved oxygen becomes too low, fish and other aquatic organisms may be impacted.